Scenario
You are a Data Engineer working on an IoT data pipeline project. The IoT devices installed in office rooms record temperature readings in Celsius and store them as CSV files. Your task is to set up a data pipeline to process this data efficiently. The Data Analytics Team has requested a cleaned and transformed version of this data, including temperature readings in Fahrenheit, to be used in their reports.
Project Overview
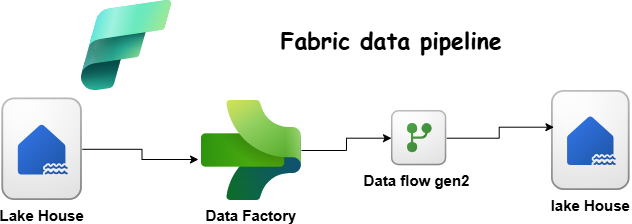
This project focuses on setting up a Fabric Lakehouse and building a simple pipeline to process IoT temperature readings from office room sensors. The goal is to ingest raw CSV files, store them in a Bronze table, and then transform the data for better usability in a Silver table.
Step 1: Setting Up the Pipeline (Bronze Layer)
What You Need to Do:
- Upload IoT temperature CSV (Download) files to the Lakehouse.
- Create a simple pipeline to load the data into a Bronze table.
Steps to Follow:
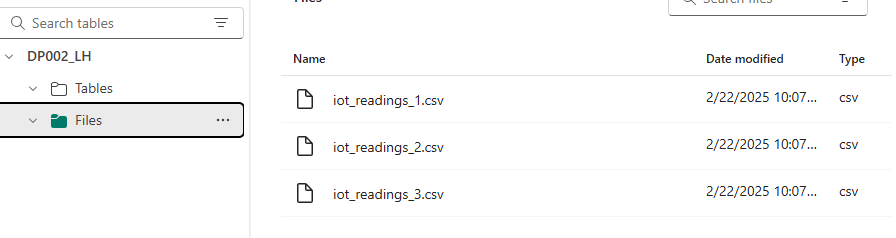
- Create a Fabric Lakehouse (Schemas disabled).
- Upload CSV files to the Files section.
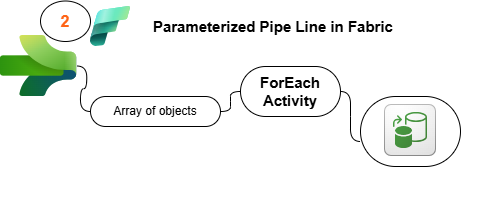
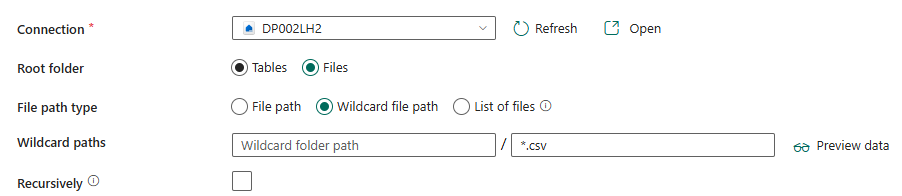
- Build a Data Pipeline with a Copy Data activity:
- Source: Files in the Lakehouse.
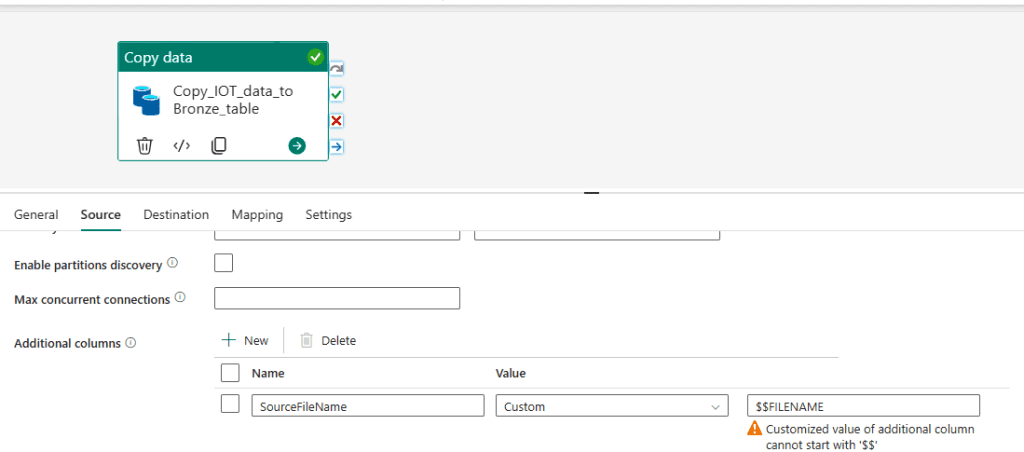
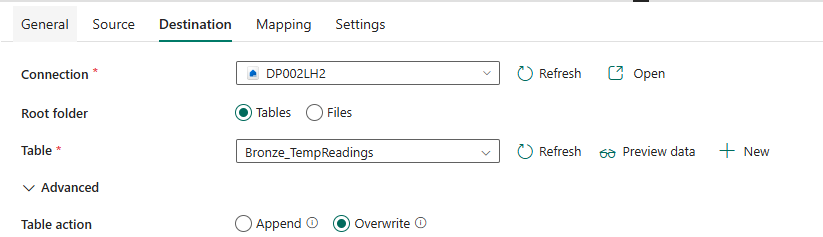
- Destination: Bronze_TempReadings table in same lake House.
- Ensure the table has these columns:
DeviceId(string)Timestamp(timestamp)Temp_Celcius(double)SourceFileName(string) (to track where the data came from)
- Run and Validate the Pipeline.

Step 2: Transforming Data (Silver Layer)
What You Need to Do:
- Convert
Temp_CelciustoTemp_Fahrenheit. - Store the cleaned data in a Silver table.
Steps to Follow:
- Use one of the following methods:
- Dataflow (drag-and-drop transformation tool)
- Notebook (SparkSQL or PySpark)
- Here I am using Data Flow Gen2
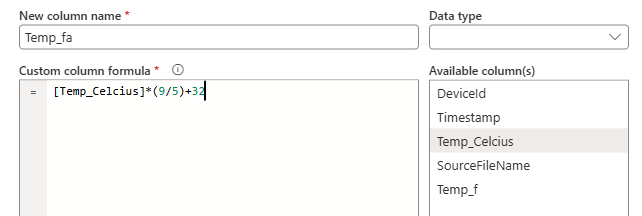
- Add a new column:
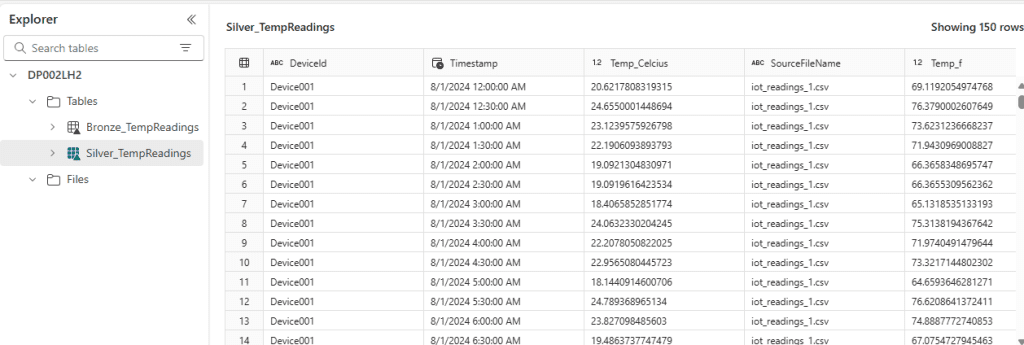
Temp_Fahrenheit(double) = (Temp_Celcius)× (9/5) + 32
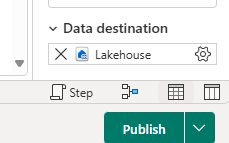
Load the transformed data into a new table Silver_TempReadings In same lake house
- Modify the existing pipeline to include a transformation step.
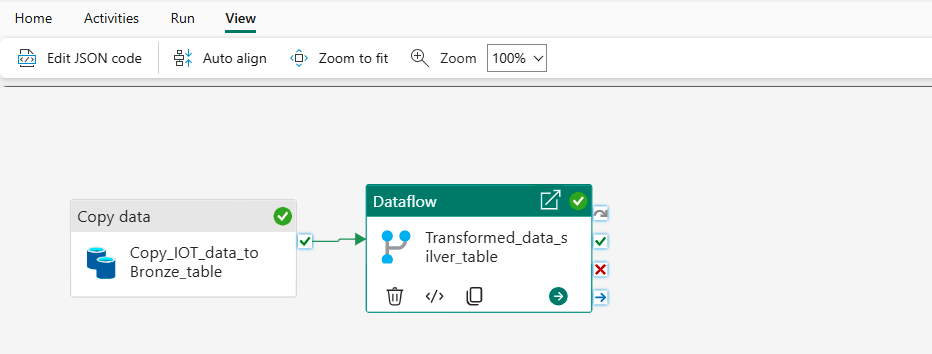
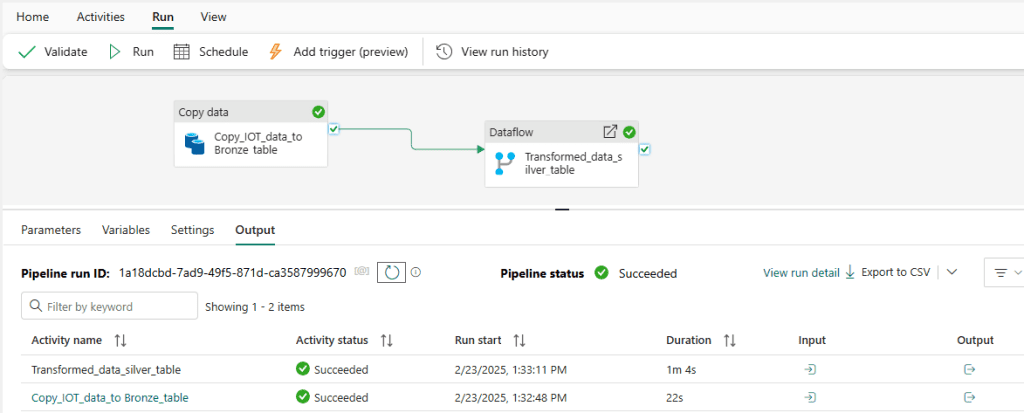
- Run and Validate the Pipeline.
Quick Reflection
Things to Think About:
- Why did we add
SourceFileNameto the Bronze table?- It helps track which source file the data originated from, making debugging and auditing easier.
- What challenges might arise if the CSV structure changes?
- If column names change or data types are inconsistent, the pipeline might fail.
- Missing or extra columns could require schema adjustments.
- When would a Dataflow be better than a Notebook for transformation?
- Dataflow is easier for business users and works well for simple transformations.
- Notebook (PySpark/SparkSQL) is better for complex transformations and large datasets.
- Could we use a T-SQL Script instead?
- Yes, T-SQL could be used to transform and load data, but it might not be as scalable for big data processing as Spark-based solutions.
Final Thoughts
This project gives a hands-on experience in data ingestion and transformation in Fabric. By following these simple steps, you can build an efficient data pipeline and understand key data engineering concepts. The transformed data is now ready for the Data Analytics Team to use in their reports.
Please Visit The other projects i will add in Fabric category.